Multiple sclerosis model
Multiple sclerosis is an autoimmune disease of the central nervous system (CNS) characterized by inflammatory demyelination. The disease is often accompanied by inflammation of the optic nerve, which can lead to visual impairment (Shindler et al. 2012). These visual impairments are often early symptoms of multiple sclerosis.
In previous studies, the optic nerve and retinal structures were analyzed in an experimental autoimmune encephalomyelitis model (EAE; Horstmann et al. 2013). We were able to demonstrate a strong correlation between the degree of immune cell infiltration or the demyelination value and the clinical symptoms. As soon as the optic nerve degenerated, the retina was also affected. Therefore, the retina was analyzed. Examinations of the retina showed significantly more apoptotic retinal ganglion cells (RGC) as well as a loss of RGC in EAE animals (Figure 1). Thus, structural changes of the retina were observed.Multiple sclerosis is also associated with autoimmune mechanisms (Hendrickx et al. 2014). Therefore, microglia and macrophages were investigated in the EAE model. An increase in both the microglia and macrophage population was measured, as well as increased interleukin-6 production (Horstmann et al., 2013). These mechanisms are characteristic of inflammatory processes. In a next step, the possible effect of certain therapeutics on retinal structures and immune cell infiltrates should be analyzed.
Figure 1: Retinal ganglion cell decline
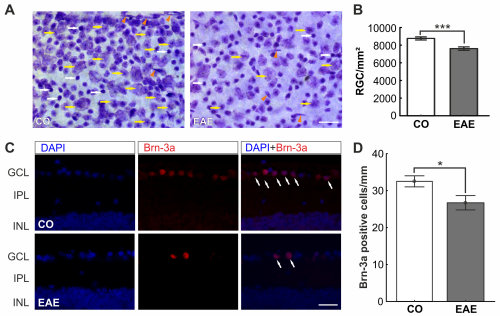
A) Cells of the flatmounts were labelled with an unspecific Nissel dye. B) A significant decrease of the RGCs was noted (p<0.001). C) To verify the result, RGCs were visualized with a specific marker, Brn-3a (red), on cross-sections of the retina (white arrows). D) Also with the specific marker, a cell loss was detected (p=0.02). Scale bar: 25 µm. Data are mean ± SEM. *: p<0.05; ***: p<0.001. Abbreviations: CO=control, EAE=treated; GCL=ganglion cell layer, IPL=inner plexiform layer, INL=inner nuclear layer (Modified from Horstmann et al., 2013).
Experimental model for neuromyelitis optica spectrum disorders
CNS disorders have a profound impact on patients due to the potential development of disability. While MS is the most common cause, there is also a spectrum of relatively rare neuroinflammatory and neurodegenerative diseases, including neuromyelitis optica spectrum disorders (NMOSD). A total of 25% of patients with an NMOSD phenotype have autoantibodies directed against the myelin oligodendrocyte glycoprotein (MOG; Delarasse et al. 2003). To better understand the pathogenesis of the disease, we used an animal model of spontaneous opticospinal encephalomyelitis (OSE). OSE mice spontaneously develop progressive encephalomyelitis characterized by inflammation and demyelination of the spinal cord and optic nerve (Optic Neuritis Study 2008; Krishnamoorthy et al. 20106).
In our study, we have already investigated the longitudinal dynamics of morphological, functional and structural retinal changes as well as (immuno)histochemical changes of the optic nerve in OSE mice. We were able to show that OSE mice exhibited clinical signs of encephalomyelitis at day 38 with an incidence of 75%. We then examined the number of RGCs in 6- and 8-week-old mice. After 6 weeks, the number of RGCs was reduced by 37.8% in OSE mice compared to the control group. In 8-week-old OSE mice, a 27.4 % decrease in RGCs was observed (Figure 2A-C). Accordingly, the mRNA expression levels of the RGC marker Pou4f1 were significantly downregulated in both the 6-week-old and 8-week-old OSE mice.
Figure 2: Retinal ganglion cell loss in OSE mice
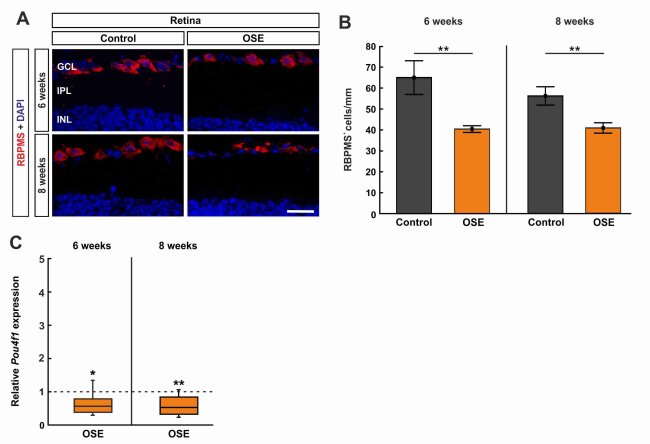
A) Retinal ganglion cells were stained with RBPMS (red) on retinal cross-sections. Cell nuclei were labelled with DAPI (blue). B) The RGC number was significantly reduced in the OSE group at six and eight weeks. C) A significant downregulation of Pou4f1 mRNA was noted in OSE mice at six and eight weeks. Scale bar: 20 µm. Data are mean ± SEM for immunohistochemistry, relative values for RT-qPCR are median ± quartile ± maximum/minimum. The dotted line in C represents the relative expression level of the control group. *p < 0.05, **p < 0.01. Abbreviations: GCL=ganglion cell layer; IPL=inner plexiform layer; INL=inner nuclear layer. (Petrikowski et al., 2022)