Acoustic Analysis of Speech
Spectrogram
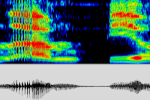
A spectrum provides a three-dimensional visual representation of acoustical signals. The horizontal axis shows positive time toward the right, the vertical axis represents frequencies up to – usually - 4000Hz, and the colours (or grey-levels) represent the most important peaks for a given time frame. In our picture, regions of highest energy levels are red whereas those of lowest energy are blue and black. A spectrum provides a visual representation of the most relevant acoustic information of speech signals. The grey panel below the spectrum shows the corresponding speech wave, i.e. the variations of sound pressure over time.
Fundamental Frequency
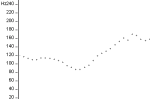
The fundamental frequency is defined as the frequency with which the vocal folds open and close during speech. The fundamental frequency can be determined from an analysis of the acoustic speech signal. For the voiced parts of the speech, the diagram shows the frequency of the vocal folds over time.
Electroglottogram
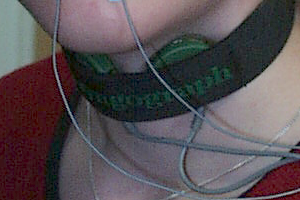
For an electroglottogram on both sides of the larynx two gold electrodes are placed at a level corresponding to the position of the vocal folds. Vibrations of the vocal folds rhythmically change the contact area between the vocal folds which can be registered as changes in the electrical resistance between the electrodes. The electroglottogram provides information about the vocal fold movements over time.
Electromyogram
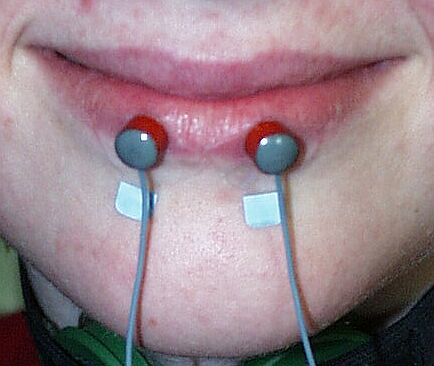
Speech sounds are realized by precisely timed speech movements. Surface electrodes which are placed on the skin over the muscles of interest, allow to register the neural activation of these muscles. In order to register neural activation of lip muscles, very small electrodes are placed on the lips. Lip movements are involved in labial closure as required for the production of /b/ and in lip protrusion which is necessary for the production of /o/. It was investigated here whether persons who stutter activate their lip muscles in a different way than persons who do not stutter.
Respiratory Activity
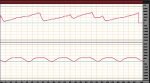
This diagram shows the difference between speech (top part) and tidal breathing (bottom part). The horizontal axis shows time, which increases from left to right, and the vertical axis represents the width of the rib cage. During expiration the width of the rib cage shrinks which is represented as an upward movement of the curves. During inspiratory movements the width of the rib cage expands which is shown as a downward movement of the curves.