Vampir
Vampir is a framework for analyzing program behavior of serial and parallel software by utilizing function instrumentation via Score-p. Vampir is licensed by HPC.nrw and can be used freely on the Elysium Cluster. This site merely shows a small test case to show how Score-p can be used to generate profiling data and how Vampir can be started on Elysium. For information how to use Vampir to analyze your application, extract useful performance metrics, and identify bottlenecks, please refer to the Score-p Cheat Sheet and the official Vampir Documentation.
Compilation with Instrumented Functions
In order to generate profiling data the function calls in the application need to be instrumented. This means inserting additional special function calls that record the time, current call stack, and much more. Fortunately, this is not done manually, but can easily achieved by using the Score-p compiler wrapper. To follow along you can use this MPI Example Code.
To use the Score-p compiler wrapper, all that is needed is to prepend the compiler by the scorep command:
module load openmpi/5.0.5-d3ii4pq
module load scorep/8.4-openmpi-5.0.5-6mtx3p6
scorep mpicc -o mpi-test.x mpi-test.c
In the case of a Makefile, or other build systems, the compiler variable has to be adjusted accordingly.
Generating Profiling Data
Profiling data is created by running the application. Note that the profiling files can grow to enormous sizes. Thus, it is advisable to choose a small representative test case for your application and not a full production run. In its default mode Score-p collects profiling data by sampling the applications call-stack from time to time. In order to generate an accurate profile tracing needs to be enabled in your job script:
module load openmpi/5.0.5-d3ii4pq
module load scorep/8.4-openmpi-5.0.5-6mtx3p6

export SCOREP_ENABLE_TRACING=true
mpirun -np 4 ./mpi-test.x
Here is a full job script for the example:
#!/bin/bash
#SBATCH --partition=cpu
#SBATCH --ntasks=4
#SBATCH --nodes=1
#SBATCH --account=<Account>
#SBATCH --time=00-00:05:00

module purge
module load openmpi/5.0.5-d3ii4pq
module load scorep/8.4-openmpi-5.0.5-6mtx3p6

export SCOREP_ENABLE_TRACING=true
mpirun -np 4 ./mpi-test.x
The execution of the instrumented application will take significantly longer than usual.
Thus, it should never be used for production runs, but merely for profiling.
After the application is finished a new directory was created, containing the time stamp and some other information in its name e.g.: scorep-20251222_0912_1523094386395226
The file traces.otf2 contains the profiling data required by Vampir.
Visualizing With Vampir
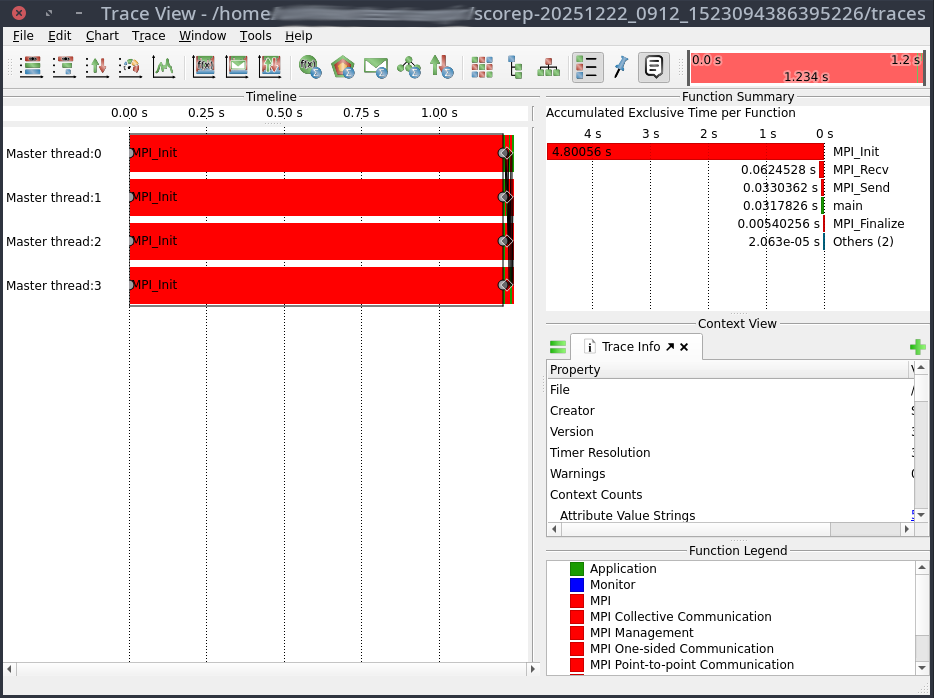
In order to visualize the profiling data a Visualization Session has to be established. Vampir can be started with
module load vampir
vglrun +pr -fps 20 vampir ./traces.otf2
This will open the Vampir graphical user interface: