Login
Login to Elysium combines the common SSH key-based authentication with web-based two-factor authentication.
Circumventing these steps
(e.g., opening sessions without the need for two factor authentication,
sharing of accounts, keys, or login credentials) violates the
IT.SERVICES Terms of Use
and may result in permanent loss of access rights to the Elysium cluster
and/or other services provided by IT.SERVICES.
In order to be able to authenticate during login
you need submit your public SSH key via the User Access Application Form
as well as enable two-factor authentication for your RUB LoginID at rub.de/login.
The additional web-based authentication is cached for 14 hours so that you
typically only have to do it once per work day, per login node, and per IP address you connect from.
After that, your normal key-based SSH workflow will work as expected.
In order to simplify the use of SSH keys we recommend to specify it as identity file in your SSH config.
This can be done by adding the following lines to your ~/.ssh/config file:
Host login00*.elysium.hpc.rub.de login00*.elysium.hpc.ruhr-uni-bochum.de
    IdentityFile ~/.ssh/elysium
    User <loginID>
where <loginID> has to be exchanged by your RUB LoginID.
If your SSH key is located in a different file the IdentityFile path needs to be adjusted accordingly.
Follow these steps:
-
Start ssh with the correct private key, your RUB LoginID, and one of the four login hosts, e.g.
ssh -i ~/.ssh/elysium LOGINID@login001.elysium.hpc.ruhr-uni-bochum.de,
or
ssh login001.elysium.hpc.rub.de if you want to use the SSH config specified above.
Available login nodes are login001 to login004.
 Note that if it is the first time you connect to the cluster you are asked to verify its identity via its host key via it’s SHA256 hash.
The Elysium Host key SHA256 hash is:
Note that if it is the first time you connect to the cluster you are asked to verify its identity via its host key via it’s SHA256 hash.
The Elysium Host key SHA256 hash is:
SHA256:nGNVhRC0bBD6FLkuJnQULhuOb/xJTebcxpdOhA99h8M
Verify the host by typing yes if the hash matches.
-
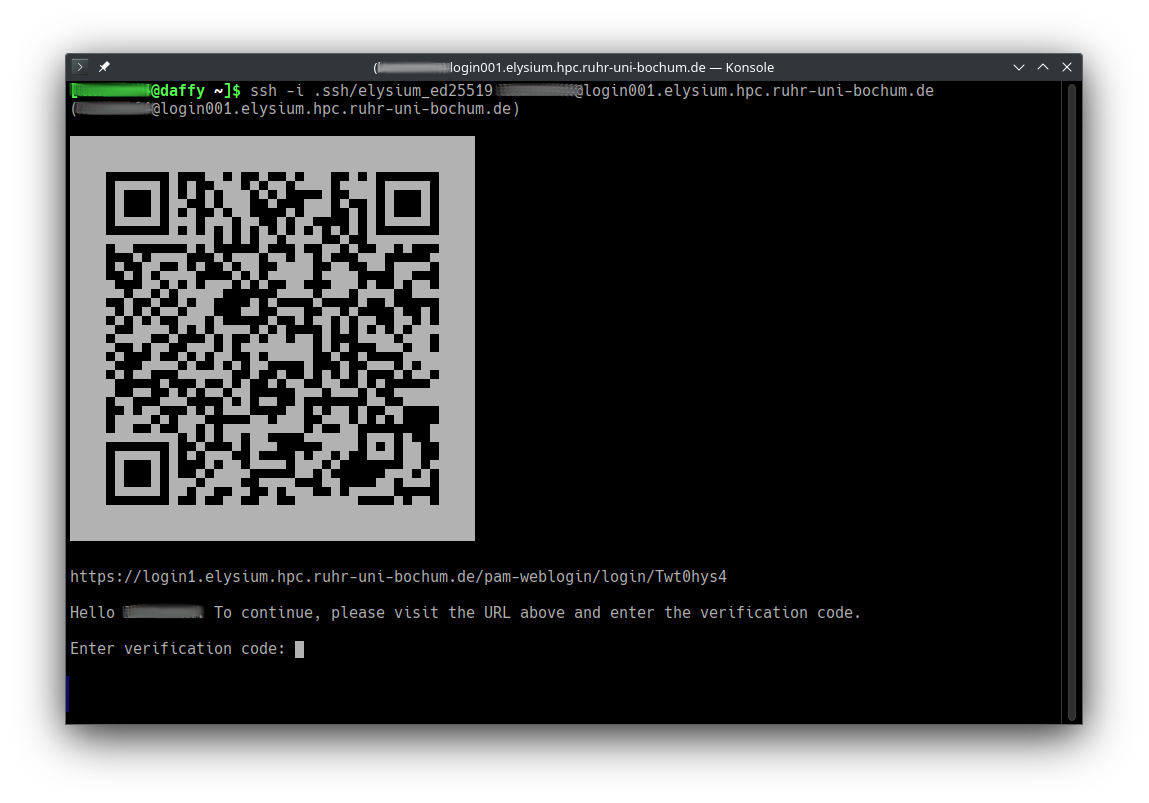
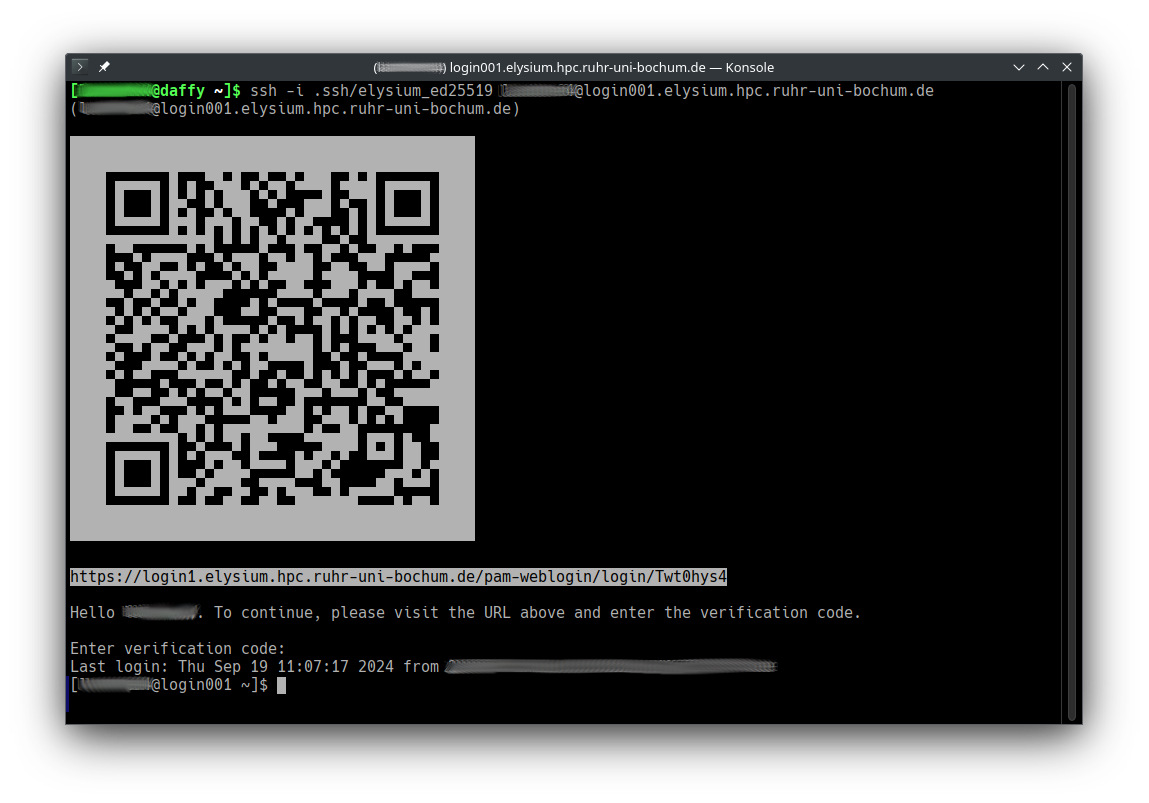
Open the URL in a browser (or scan the QR code with your smartphone) to start web-based two-factor authentication.
-
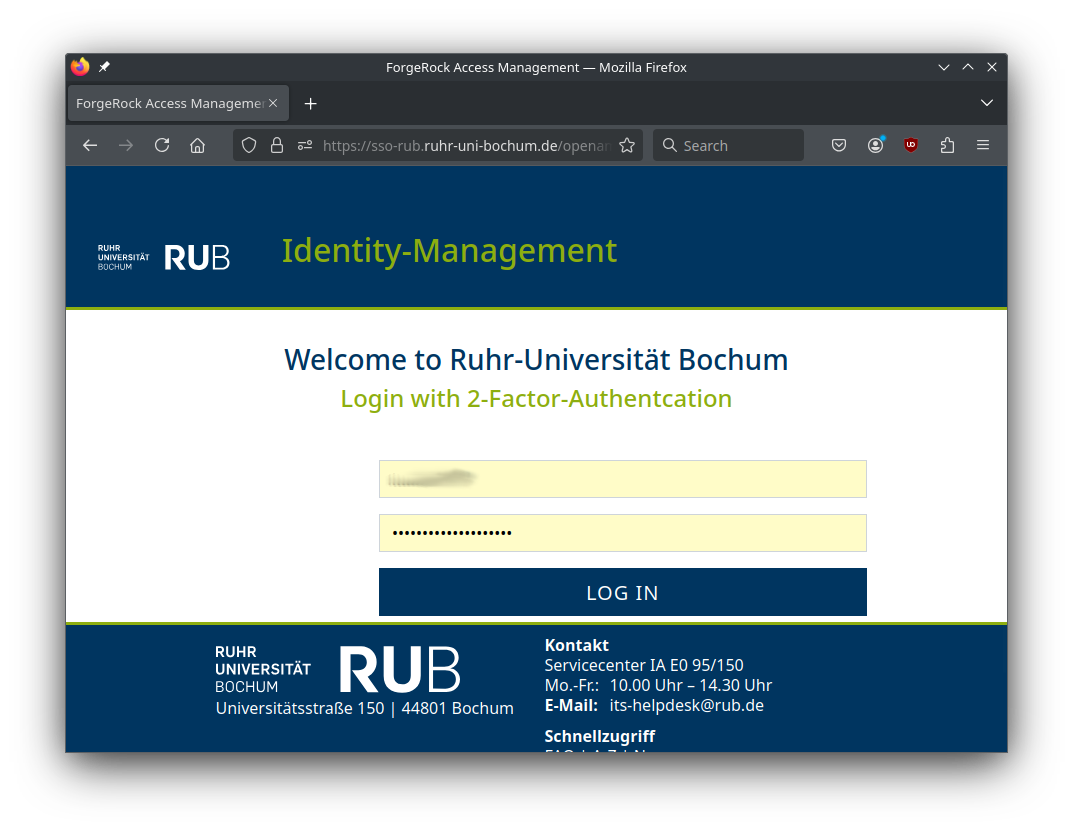
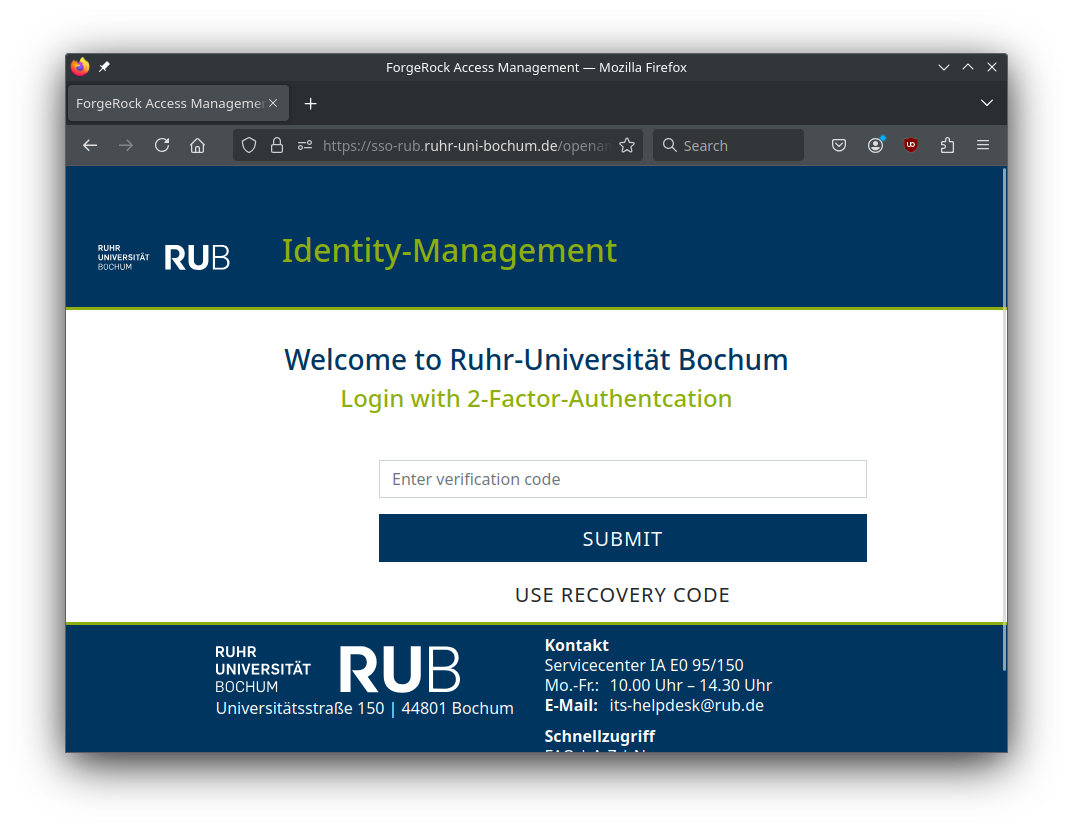
Enter the second factor for two-factor authentication.
-
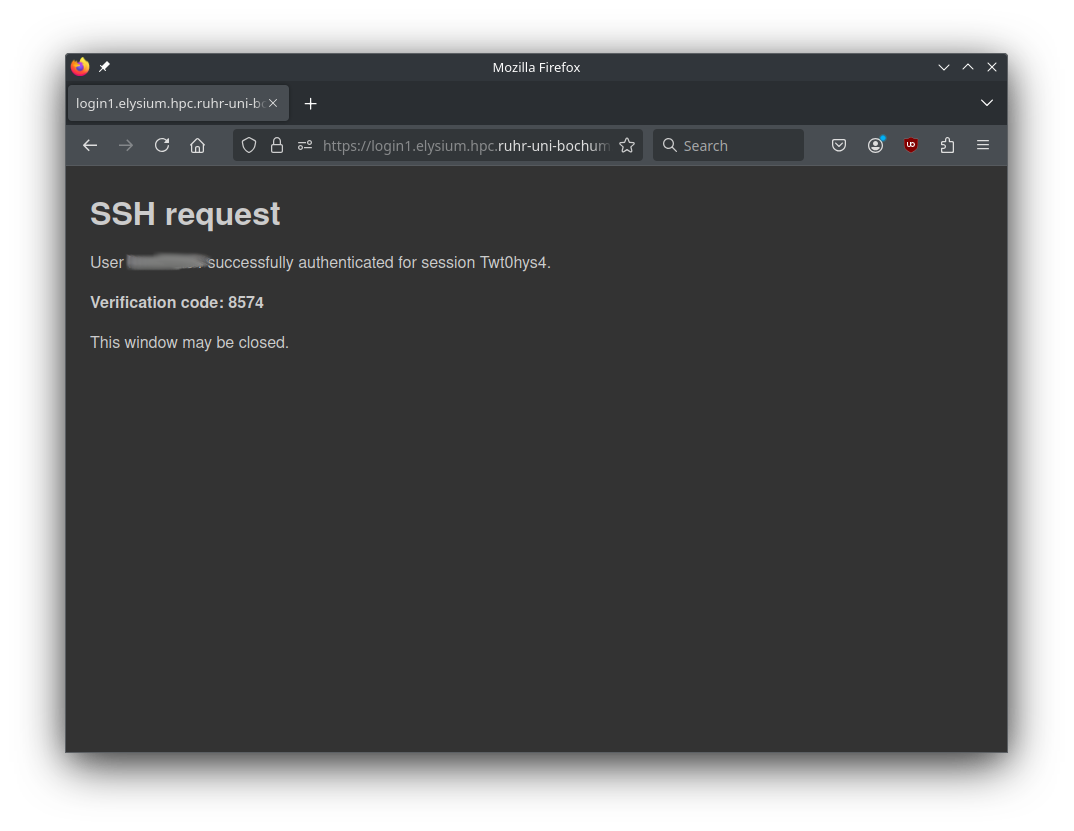
After successful login, you get a four-digit verification code.
-
Enter this code at your ssh prompt to finish login.
For the next 14 hours, only step 1 (classic key-based authentication) will
be necessary on the chosen login node for the IP address you connected from.
Login will fail if:
- You use the wrong private key (“Permission denied (publickey)”)
- You are not member of an active HPC project (“Permission denied (publickey)”)
- You did not enable two-factor authentication for your LoginID (“Two-factor authentication is required”)
- Web-based login fails
- You enter the wrong verification code (“Verification failed”)
- A timeout happens between starting the SSH session and finalizing web-based login (“session_id not found”);
just start the process again to get a new session ID.
Subsections of Software
Modules
We use the Lmod module system to provide compilers, MPI stacks, libraries, and tools.
The legacy module tree (elysium/2024) is currently the default view.
To switch to the current tree, load:
The elysium/202x modules modify the MODULEPATH.
They are sticky, so they are not removed by module purge.
elysium/2024 and elysium/2026 are mutually exclusive: loading one unloads the other.
The legacy tree (elysium/2024) is frozen and no longer updated by admins.
The 2026 tree is built with gcc@13.4.0, which provides better optimization support for Elysium’s Zen 4 CPUs than gcc@11.
Known Issues
- Intel MPI in
elysium/2024 (legacy tree) is known to be unstable in this version. It can cause random MPI deadlocks where applications stop progressing while the Slurm job is still running.
- In the current tree (
elysium/2026), Intel MPI is stable and recommended.
- MPICH versions before
5.0.0 are not suitable for multi-node runs. Use 5.0.0 or newer for multi-node jobs.
- If you must use MPICH
< 5.0.0, restrict jobs to single-node execution.
Common module commands
ml is a short alias for module.
ml av: list available modules in the current module path.ml load <module>: load a module. Example: ml load openmpi/5.0.9.ml list: show currently loaded modules.ml unload <module>: unload a module. Example: ml unload openmpi/5.0.9.ml purge: unload all currently loaded modules except sticky ones.ml help <module>: show module help text. Example: ml help openmpi/5.0.9.ml show <module>: print the contents of the modulefile.ml whatis <module>: show a short module description.ml spider <name>: search all known versions. Use ml spider -A <name> to also show hidden entries.ml use <path>: add a directory to your module search path.ml unuse <path>: remove a directory from your module search path.
Using your own modulefiles
You can keep your own modulefiles in a personal directory and add it with ml use.
mkdir -p "$HOME/modules/mytool"
cat > "$HOME/modules/mytool/1.0.lua" <<'LUA'
help([[MyTool 1.0]])
whatis("Name: MyTool")
whatis("Version: 1.0")
depends_on("openmpi/5.0.9")
prepend_path("PATH", "/path/to/mytool/bin")
LUA

ml use "$HOME/modules"
ml load mytool/1.0
In this example, loading mytool/1.0 also loads openmpi/5.0.9 as a dependency.
To make your personal modules always visible, add this to your ~/.bashrc:
If you need additional software or module versions, please contact support.
Spack
We provide a central Spack 1.1.1 installation in parallel to the existing 0.23.0 stack.
This separation is necessary because a database migration would render the 0.23.0 installation unusable.
The new 2026 module tree is not compatible with the legacy tree, and self-built packages from the old setup must be rebuilt.
By default, you will still see the legacy module tree.
The new stack is opt-in via:
If you already used the legacy setup, use this dedicated migration guide:
Migration Guide for Existing Users.
Legacy documentation remains available here:
Spack (Legacy 0.23.0).
Table of Contents
- Quick Setup (New Users)
- Architecture Overview
- Guide to Using Spack
- What Is New in Modern Spack
- Legacy Setup
Quick Setup
For a fresh setup:
rub-deploy-spack-configs-2026
module load spack/2026
After that, you can install your own packages into your home Spack tree and generate personal modulefiles.
Add module load spack/2026 to your ~/.bashrc if you want this active in ever login shell.
Architecture Overview
We use a central Spack installation combined with per-user overlays:
Central Spack (read-only, maintained by HPC)
    ├─ pre-built packages
    ├─ MPI configurations
    └─ cluster-wide defaults
            ↓ (upstream)
User Spack ($HOME)
    ├─ personal installs
    └─ personal modules
            ↓
Lmod module system
This means:
- You automatically use centrally installed packages when available.
- Cluster-wide configurations (e.g. MPI defaults, compiler settings) are inherited.
- Your own installations go into your personal
$HOME Spack tree.
- Only missing packages are built locally.
Guide to Using Spack
This section covers the most common Spack workflows on Elysium.
Searching and Inspecting Packages
Search for packages:
spack list <keyword>
spack list openfoam
Show details (versions, variants, dependencies):
Preview what will actually be installed:
Always check spack spec before installing complex packages.
Installing Packages
Basic installation:
Enable or disable variants:
spack install hdf5 +mpi +cxx ~fortran
Specify a compiler:
spack install hdf5 %gcc@13.4.0
Force rebuilding dependencies with the same compiler:
spack install --fresh hdf5 %gcc@13.4.0
Specify dependencies explicitly:
spack install hdf5 ^openmpi@5.0.9
Everything combined:
spack install hdf5@1.14.6 +mpi %gcc@13.4.0 ^openmpi@5.0.9
Virtual Providers (BLAS, MPI, FFT, etc.)
Some packages depend on virtual interfaces instead of concrete libraries.
Examples include:
To see which virtual packages exist:
To list available providers for a specific interface:
spack providers blas
spack providers fftw-api
Example output:
Providers for blas:
    amdblis
    openblas
    intel-oneapi-mkl
You can select a specific provider during installation:
spack install gromacs ^blas=openblas
This is often preferred over manually selecting a specific concrete library, because it keeps the dependency graph clean and compatible.
Inspecting and Comparing Installations
List installed packages with variants and hashes:
Inspect a specific installation:
Compare two installations:
Removing Packages
Remove a specific installation by hash:
Overriding Package Definitions
On Elysium, the central builtin repository is provided by the HPC team. If you want to override a package definition (e.g. to test changes), you can create a local repository on top of it.
Create a local repo
mkdir -p $HOME/spack/var/spack/repos/packages
cat > $HOME/spack/var/spack/repos/repo.yaml <<'EOF'
repo:
  namespace: overrides
EOF
Register it in ~/.spack/repos.yaml (place it above builtin to override):
repos:
  overrides: $HOME/spack/var/spack/repos
  builtin:
    destination: /cluster/spack/spack-packages
Check:
Override a package (example: ffmpeg)
mkdir -p $HOME/spack/var/spack/repos/packages/ffmpeg
cp /cluster/spack/spack-packages/repos/spack_repo/builtin/packages/ffmpeg/package.py \
   $HOME/spack/var/spack/repos/packages/ffmpeg/
Edit the copied package.py and adjust versions, dependencies, variants, etc.
Install explicitly from your namespace:
spack install overrides.ffmpeg
Verify which repository is used
For a spec (not yet installed):
For installed packages:
The -N option shows the namespace (overrides or builtin).
Custom Changes to Packages using spack develop
If you want to modify the source code of a package (e.g. openfoam) and rebuild it locally, you can use spack develop. This allows you to work directly on a source checkout without creating tarballs or calculating checksums.
Create and activate a development environment
mkdir -p ~/openfoam-dev
cd ~/openfoam-dev
spack env create -d .
spacktivate . #shortcut for `spack env activate .`
Using a dedicated environment keeps your development work isolated from your normal Spack setup.
Add and install the package
spack add openfoam
spack install
This performs a normal installation and ensures all dependencies are available.
Switch to development mode
This checks out the source code into the environment directory (e.g. ~/openfoam-dev/openfoam/) and registers it as the active development source.
You can verify this with:
Look for dev_path=.../openfoam in the output.
Modify the source and rebuild
cd ~/openfoam-dev/openfoam
# edit source files here (e.g. with vim)

cd ~/openfoam-dev
spack install
Spack will now build openfoam from your modified local sources.
If compilation fails, Spack will print the relevant error messages and the path to the full build log.
Legacy Setup
If you need to reference the old 0.23.0 setup, use:
Spack (Legacy 0.23.0).
MATLAB
This page describes how to configure MATLAB to submit jobs to the Elysium HPC cluster, retrieve results, and debug errors.
Initial Configuration
Running MATLAB on the HPC Cluster
This setup is intended for job submission when you are logged directly into the cluster via the command line. This process only needs to be completed once per cluster.
After logging into the cluster, start MATLAB and run:
Jobs will run across multiple nodes on the cluster rather than on the host machine.
Running MATLAB on the Desktop
This setup is intended for job submission when MATLAB is installed on your machine and jobs are run remotely on the cluster. This setup needs to be done once per cluster, per version of MATLAB installed on your machine.
Start MATLAB and run:
Download the Integration Scripts (RUB.Desktop.zip) directly from this page. Extract the ZIP contents into the folder returned by userpath.
Create a new cluster profile:
Submission to the cluster requires SSH credentials. You will be prompted for your cluster username (LoginID).
Jobs will now run on the cluster rather than on the local machine. Before submitting jobs, log in to login002 via SSH on the command line so the two-factor authentication login is cached.
Note
To run jobs on the local machine instead of the cluster, use the Processes profile.
% Get a handle to the local resources
c = parcluster('Processes');
Configuring Jobs
Prior to submitting a job, you can assign scheduler flags such as queue, email, wall time, and more. The following properties are mandatory and must be set before you can submit a job:
AccountNameNodesPartitionWallTime
% Get a handle to the cluster
c = parcluster;

% REQUIRED

% Specify an account
c.AdditionalProperties.AccountName = 'account-name';

% Specify number of nodes
c.AdditionalProperties.Nodes = 1;

% Specify the partition
c.AdditionalProperties.Partition = 'partition-name';

% Specify the wall time (e.g. 1 day, 5 hours, 30 minutes)
c.AdditionalProperties.WallTime = '1-05:30';

% OPTIONAL

% Specify a constraint
c.AdditionalProperties.Constraint = 'feature-name';

% Request email notification of job status
c.AdditionalProperties.EmailAddress = 'firstname.familyname@ruhr-uni-bochum.de';

% Specify number of GPUs (default: 0)
c.AdditionalProperties.GPUsPerNode = 1;

% Specify the number of CPUs per GPU
c.AdditionalProperties.CPUsPerGPU = 1;

% Specify memory to use, per core (default: 4GB)
c.AdditionalProperties.MemPerCPU = '6GB';

% Specify cores per node (default: 0)
c.AdditionalProperties.ProcsPerNode = 4;

% Set node exclusivity (default: false)
% Note that this will automatically be set to true if using more
% than one node.
c.AdditionalProperties.RequireExclusiveNode = true;

% Specify a reservation
c.AdditionalProperties.Reservation = 'reservation-name';
To persist changes made to AdditionalProperties between MATLAB sessions, save the profile:
To see the values of the current configuration options, display AdditionalProperties:
Unset a value when it is no longer needed:
% Turn off email notifications
c.AdditionalProperties.EmailAddress = '';

% Do not request an entire node
c.AdditionalProperties.RequireExclusiveNode = false;
Note
The instructions above cover the basics of configuring and running jobs on the cluster. For a more in-depth walkthrough of the job submission workflow, see the demo script ScalingToTheClusterDemoRemote.mlx.
Independent Batch Job - MATLAB on the HPC Cluster or Desktop
Use the batch command to submit asynchronous jobs to the cluster. The batch command returns a job object, which is used to access the output of the submitted job. See the MATLAB documentation for batch for more details.
% Get a handle to the cluster
c = parcluster;

% Submit job to query where MATLAB is running on the cluster
job = c.batch(@pwd, 1, {}, 'CurrentFolder', '.', 'AutoAddClientPath', false);

% Query job for state
job.State

% If job is finished, fetch the results
job.fetchOutputs{1}

% Delete the job after results are no longer needed
job.delete
To retrieve a list of running or completed jobs, call parcluster to return the cluster object. The cluster object stores an array of jobs that are listed as queued, running, finished, or failed.
c = parcluster;
jobs = c.Jobs

% Get a handle to the second job in the list
job2 = c.Jobs(2);
Once the job has been selected, fetch the results as previously shown.
fetchOutputs is used to retrieve function output arguments. If you call batch with a script, use load instead. Data written to disk on the cluster must be retrieved directly from the file system, for example via SFTP.
% Fetch all results from the second job in the list
job2.fetchOutputs{:}

% Alternate: load results if the job was a script instead of a function
job2.load
Parallel Batch Job - MATLAB on the HPC Cluster or Desktop
The batch command also supports parallel workflows. Save the following example as parallel_example.m.
function [sim_t, A] = parallel_example(iter)

if nargin == 0
    iter = 8;
end

disp('Start sim')

A = nan(iter, 1);
t0 = tic;
parfor idx = 1:iter
    A(idx) = idx;
    pause(2)
    idx
end
sim_t = toc(t0);

disp('Sim completed')

save RESULTS A

end
When using the batch command, specify a Pool argument:
% Get a handle to the cluster
c = parcluster;

% Submit a batch pool job using 4 workers for 16 simulations
job = c.batch(@parallel_example, 1, {16}, 'CurrentFolder', '.', 'Pool', 4, 'AutoAddClientPath', false);

% View current job status
job.State

% Fetch the results after a finished state is retrieved
job.fetchOutputs{1}
Example output:
The job ran in 8.17 seconds using four workers. Note that these jobs always request N + 1 CPU cores, since one worker is required to manage the batch job and pool of workers. For example, a job that needs eight workers will require nine CPU cores.
Run the same simulation again but increase the pool size. This time, to retrieve the results later, keep track of the job ID.
Note
For some applications, there will be diminishing returns when allocating too many workers, as the overhead may exceed computation time.
% Get a handle to the cluster
c = parcluster;

% Submit a batch pool job using 8 workers for 16 simulations
job = c.batch(@parallel_example, 1, {16}, 'CurrentFolder', '.', 'Pool', 8, 'AutoAddClientPath', false);

% Get the job ID
id = job.ID
Example output:
% Clear job from workspace (as though MATLAB exited)
clear job
With a handle to the cluster, the findJob method searches for the job with the specified job ID:
% Get a handle to the cluster
c = parcluster;

% Find the old job
job = c.findJob('ID', 4);

% Retrieve the state of the job
job.State
Example output:
% Fetch the results
job.fetchOutputs{1};
Example output:
The job now runs in 4.15 seconds using eight workers. Run code with different numbers of workers to determine the ideal number to use.
Alternatively, to retrieve job results via a graphical user interface, use the Job Monitor (Parallel > Monitor Jobs). It will take some time until the list is shown.


Debugging
If a serial job produces an error, call the getDebugLog method to view the error log file.
When submitting an independent job, specify the task:
For pool jobs, specify only the job object:
When troubleshooting a job, the cluster administrators may request the scheduler ID of the job. You can derive it by calling getTaskSchedulerIDs:
job.getTaskSchedulerIDs()
Example output:
Helper Functions
| Function |
Description |
Notes |
clusterFeatures |
Lists cluster features / constraints |
|
clusterGpuCards |
Lists cluster GPU cards |
|
clusterPartitionNames |
Lists cluster partition / queue names |
|
disableArchiving |
Modifies file archiving to resolve file mirroring issues |
Applicable only to Desktop |
fixConnection |
Reestablishes cluster connection (for example after reconnecting VPN) |
Applicable only to Desktop |
seff |
Displays Slurm statistics related to the efficiency of resource usage by the job |
|
willRun |
Explains why a job is queued |
|
To Learn More
To learn more about the MATLAB Parallel Computing Toolbox, see:
Vampir
Vampir is a framework for analyzing program behavior of serial and parallel software by utilizing function instrumentation via Score-p.
Vampir is licensed by HPC.nrw and can be used freely on the Elysium Cluster.
This site merely shows a small test case to show how Score-p can be used to generate profiling data and how Vampir can be started on Elysium.
For information how to use Vampir to analyze your application, extract useful performance metrics, and identify bottlenecks, please refer to the Score-p Cheat Sheet and the official Vampir Documentation.
Compilation with Instrumented Functions
In order to generate profiling data the function calls in the application need to be instrumented.
This means inserting additional special function calls that record the time, current call stack, and much more.
Fortunately, this is not done manually, but can easily achieved by using the Score-p compiler wrapper.
To follow along you can use this
MPI Example Code.
To use the Score-p compiler wrapper, all that is needed is to prepend the compiler by the scorep command:
module load openmpi/5.0.5-d3ii4pq
module load scorep/8.4-openmpi-5.0.5-6mtx3p6
scorep mpicc -o mpi-test.x mpi-test.c
In the case of a Makefile, or other build systems, the compiler variable has to be adjusted accordingly.
Generating Profiling Data
Profiling data is created by running the application.
Note that the profiling files can grow to enormous sizes.
Thus, it is advisable to choose a small representative test case for your application and not a full production run.
In its default mode Score-p collects profiling data by sampling the applications call-stack from time to time. In order to generate an accurate profile tracing needs to be enabled in your job script:
module load openmpi/5.0.5-d3ii4pq
module load scorep/8.4-openmpi-5.0.5-6mtx3p6

export SCOREP_ENABLE_TRACING=true
mpirun -np 4 ./mpi-test.x
Here is a full job script for the example:
#!/bin/bash
#SBATCH --partition=cpu
#SBATCH --ntasks=4
#SBATCH --nodes=1
#SBATCH --account=<Account>
#SBATCH --time=00-00:05:00

module purge
module load openmpi/5.0.5-d3ii4pq
module load scorep/8.4-openmpi-5.0.5-6mtx3p6

export SCOREP_ENABLE_TRACING=true
mpirun -np 4 ./mpi-test.x
The execution of the instrumented application will take significantly longer than usual.
Thus, it should never be used for production runs, but merely for profiling.
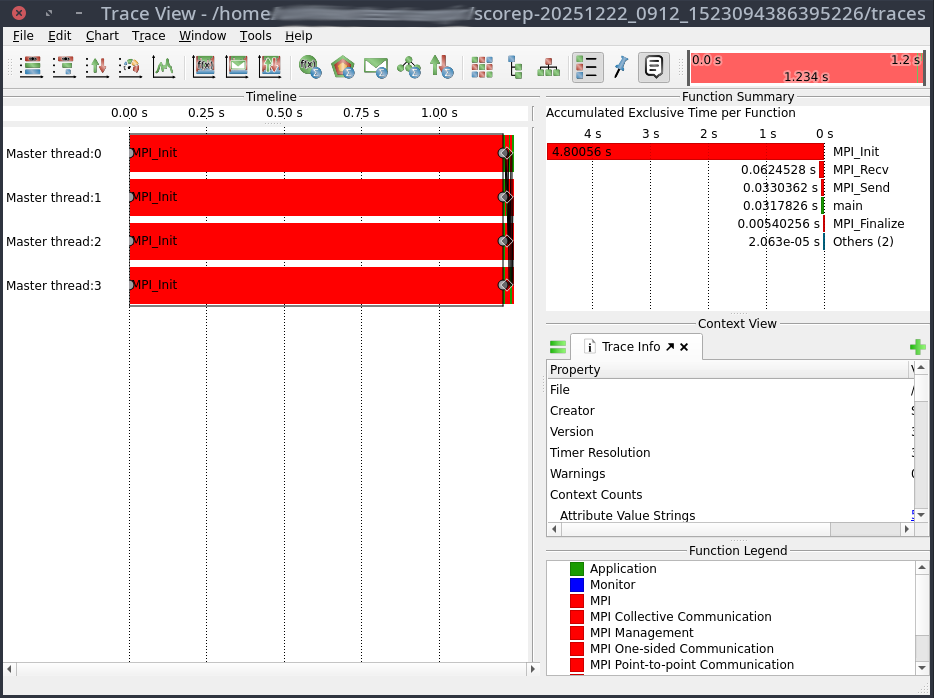
After the application is finished a new directory was created, containing the time stamp and some other information in its name e.g.: scorep-20251222_0912_1523094386395226
The file traces.otf2 contains the profiling data required by Vampir.
Visualizing With Vampir
In order to visualize the profiling data a
Visualization Session
has to be established.
Vampir can be started with
module load vampir
vglrun +pr -fps 20 vampir ./traces.otf2
This will open the Vampir graphical user interface:
VASP
Build configuration (MKL)
On Elysium, VASP can be built with Spack using:
spack install vasp@6.4.3 +openmp +fftlib ^openmpi@5.0.5 ^fftw@3+openmp ^intel-oneapi-mkl threads=openmp +ilp64
This configuration uses:
- Intel oneAPI MKL (ILP64) for BLAS, LAPACK and ScaLAPACK,
- VASP’s internal FFTLIB to avoid MKL CDFT issues on AMD,
- OpenMPI 5.0.5 as MPI implementation,
- OpenMP enabled for hybrid parallelisation.
We choose MKL as baseline because it is the de-facto HPC standard and performs well on AMD EPYC when AVX512 code paths are enabled.
Activating AVX512
Intel’s MKL only enables AVX512 optimisations on Intel CPUs.
On AMD, MKL defaults to AVX2/SSE code paths.
To unlock the faster AVX512 kernels on AMD EPYC we provide libfakeintel, which fakes Intel CPUID flags.
| MKL version |
library to preload |
|
| ≤ 2024.x |
/lib64/libfakeintel.so |
|
| ≥ 2025.x |
/lib64/libfakeintel2025.so |
works for older versions too |
⚠ Intel gives no guarantee that all AVX512 instructions work on AMD CPUs.
In practice, the community has shown that not every kernel uses full AVX512 width, but the overall speed-up is still substantial.
Activate AVX512 by preloading the library in your job:
export LD_PRELOAD=/lib64/libfakeintel2025.so:${LD_PRELOAD}
Test case 1 – Si256 (DFT / Hybrid HSE06)
This benchmark uses a 256-atom silicon supercell (Si256) with the HSE06 hybrid functional.
Hybrid DFT combines FFT-heavy parts with dense BLAS/LAPACK operations and is therefore a good proxy for most large-scale electronic-structure workloads.
Baseline: MPI-only, 1 node
| Configuration |
Time [s] |
Speed-up vs baseline |
| MKL (no AVX512) |
2367 |
1.00× |
| MKL (+ AVX512) |
2017 |
1.17× |
→ Always enable AVX512.
The baseline DFT case runs 17 % faster with libfakeintel,
Build configuration (AOCL)
AOCL (AMD Optimized Libraries) is AMD’s analogue to MKL, providing:
- AMDBLIS (BLAS implementation)
- AMDlibFLAME (LAPACK)
- AMDScaLAPACK, AMDFFTW optimised for AMD EPYC
- built with AOCC compiler
Build example:
spack install vasp@6.4.3 +openmp +fftlib %aocc ^amdfftw@5 ^amdblis@5 threads=openmp ^amdlibflame@5 ^amdscalapack@5 ^openmpi
AOCL detects AMD micro-architecture automatically and therefore does not require libfakeintel.
Baseline: MPI-only, 1 node
| Configuration |
Time [s] |
Speed-up vs baseline |
| MKL (+ AVX512) |
2017 |
1.00 |
| AOCL (AMD BLIS / libFLAME) |
1919 |
1.05 |
The AOCl build is another 5% faster than MKL with AVX512 enabled.
Hybrid parallelisation and NUMA domains
Each compute node has two EPYC 9254 CPUs with 24 cores each (48 total).
Each CPU is subdivided into 4 NUMA domains with separate L3 caches and memory controllers.
- MPI-only: 48 ranks per node (1 per core).
- Hybrid L3: 8 MPI ranks × 6 OpenMP threads each, bound to individual L3 domains.
This L3-hybrid layout increases memory locality, because each rank mainly uses its own local memory and avoids cross-socket traffic.
Single-node hybrid results (Si256)
| Configuration |
Time [s] |
Speed-up vs MPI-only |
| MKL (L3 hybrid) |
1936 |
1.04× |
| AOCL (L3 hybrid) |
1830 |
1.05× |
Hybrid L3 adds a modest 4-5 % speed-up.
Multi-node scaling (Si256)
| Configuration |
Nodes |
Time [s] |
Speed-up vs 1-node baseline |
| MKL MPI-only |
2 |
1305 |
1.55× |
| AOCL MPI-only |
2 |
1142 |
1.68× |
| MKL L3 hybrid |
2 |
1147 |
1.69× |
| AOCL L3 hybrid |
2 |
968 |
1.89× |
Interpretation
AOCL shows the strongest scaling across nodes; MKL’s hybrid variant catches up in scaling compared to its MPI-only counterpart.
The L3-hybrid layout maintains efficiency even in the multi-node regime.
Recommendations for DFT / Hybrid-DFT workloads
- AOCL generally outperforms MKL (+AVX512) on AMD EPYC.
- Prefer L3-Hybrid (8×6) on single-node and even multi-node jobs for FFT-heavy hybrid-DFT cases.
- For pure MPI runs, both MKL (+AVX512) and AOCL scale well; AOCL slightly better.
- Always preload libfakeintel2025.so if MKL is used.
Jobscript examples
AOCL – Hybrid L3 (8×6)
#!/bin/bash
#SBATCH -J vasp_aocl_l3hyb
#SBATCH -N 1
#SBATCH --ntasks=8
#SBATCH --cpus-per-task=6
#SBATCH -p cpu
#SBATCH -t 48:00:00
#SBATCH --exclusive

module purge
module load vasp-aocl

export OMP_NUM_THREADS=6
export OMP_PLACES=cores
export OMP_PROC_BIND=close
export BLIS_NUM_THREADS=6

mpirun -np 8 --bind-to l3 --report-bindings vasp_std
MKL (+AVX512) – Hybrid L3 (8×6)
#!/bin/bash
#SBATCH -J vasp_mkl_avx512_l3hyb
#SBATCH -N 1
#SBATCH --ntasks=8
#SBATCH --cpus-per-task=6
#SBATCH -p cpu
#SBATCH -t 48:00:00
#SBATCH --exclusive

module purge
module load vasp-mkl
export LD_PRELOAD=/lib64/libfakeintel2025.so:${LD_PRELOAD}

export OMP_NUM_THREADS=6
export OMP_PLACES=cores
export OMP_PROC_BIND=close
export MKL_NUM_THREADS=6
export MKL_DYNAMIC=FALSE

mpirun -np 8 --bind-to l3 --report-bindings vasp_std
Test case 2 – XAS (Core-level excitation)
The XAS Mn-in-ZnO case models a core-level excitation (X-ray Absorption Spectroscopy).
These workloads are not FFT-dominated; instead they involve many unoccupied bands and projector evaluations.
Single-node results (XAS)
| Configuration |
Time [s] |
Relative |
| MKL MPI-only |
897 |
1.00× |
| AOCL MPI-only |
905 |
0.99× |
| MKL L3 hybrid |
1202 |
0.75× |
| AOCL L3 hybrid |
1137 |
0.79× |
Multi-node scaling (XAS)
| Configuration |
Nodes |
Time [s] |
Relative |
| MKL MPI-only |
2 |
1333 |
0.67× |
| AOCL MPI-only |
2 |
1309 |
0.69× |
| MKL L3 hybrid |
2 |
1366 |
0.66× |
| AOCL L3 hybrid |
2 |
1351 |
0.67× |
Interpretation
For core-level / XAS calculations, hybrid OpenMP parallelisation is counter-productive, and scaling beyond one node deteriorates performance due to load imbalance and communication overhead.
Recommendations for XAS and similar workloads
- Use MPI-only and single-node configuration.
- MKL and AOCL perform identically within margin of error.
- Hybrid modes reduce efficiency and should be avoided.
- Set
OMP_NUM_THREADS=1 to avoid unwanted OpenMP activity.
General guidance
For optimal performance on Elysium with AMD EPYC processors, we recommend using the AOCL build as the default choice for all VASP workloads. AOCL consistently outperforms or matches MKL (+AVX512) across tested scenarios (e.g., 5 % faster for Si256 single-node, up to 1.89× speedup for multi-node scaling) and does not require additional configuration like libfakeintel. However, MKL remains a robust alternative, especially for users requiring compatibility with existing workflows.
| Workload type |
Characteristics |
Recommended setup |
| Hybrid DFT (HSE06, PBE0, etc.) |
FFT + dense BLAS, OpenMP beneficial |
AOCL L3 Hybrid (8×6) |
| Standard DFT (PBE, LDA) |
light BLAS, moderate FFT |
AOCL L3 Hybrid or MPI-only |
| Core-level / XAS / EELS |
many unoccupied bands, projectors |
AOCL MPI-only (single-node) |
| MD / AIMD (>100 atoms) |
large FFTs per step |
AOCL L3 Hybrid |
| Static small systems (<20 atoms) |
few bands, small matrices |
AOCL MPI-only |
Recommendations:
- Default to AOCL: Use the AOCL build for all workloads unless specific constraints (e.g., compatibility with Intel-based tools) require MKL.
- AVX512 for MKL: If using MKL, always preload
libfakeintel2025.so to enable AVX512 optimizations.
- Benchmark if unsure: Test both
MPI-only and L3 Hybrid on one node to determine the optimal configuration for your specific system.
SLURM
The Elysium HPC system utilizes
SLURM
as a resource manager, scheduler, and accountant in order to
guarantee fair share of the computing resources.
If you are looking for technical details
regarding the usage and underlying
mechanisms of SLURM we recommend participating in the
Introduction to HPC training course.
Examples of job scripts for different job types that are
tailored to the Elysium cluster can be found in the
Training Section.
List of Partition
All nodes in the Elysium cluster are grouped by their hardware kind,
and job submission type.
This way users can request specific computing hardware,
and multi node jobs are guaranteed to run on nodes with the same setup.
In order to get a list of the available partitions, their current state,
and available nodes, the sinfo command can be used.
 1[login_id@login001 ~]$ sinfo
 2PARTITION      AVAIL  TIMELIMIT  NODES  STATE NODELIST
 3cpu               up 7-00:00:00      4  alloc cpu[033-034,037-038]
 4cpu               up 7-00:00:00    280   idle cpu[001-032,035-036,039-284]
 5cpu_filler        up    3:00:00      4  alloc cpu[033-034,037-038]
 6cpu_filler        up    3:00:00    280   idle cpu[001-032,035-036,039-284]
 7fat_cpu           up 2-00:00:00     13   idle fatcpu[001-013]
 8fat_cpu_filler    up    3:00:00     13   idle fatcpu[001-013]
 9gpu               up 2-00:00:00     20   idle gpu[001-020]
10gpu_filler        up    1:00:00     20   idle gpu[001-020]
11fat_gpu           up 2-00:00:00      1 drain* fatgpu005
12fat_gpu           up 2-00:00:00      5    mix fatgpu[001,003-004,006-007]
13fat_gpu           up 2-00:00:00      1   idle fatgpu002
14fat_gpu_filler    up    1:00:00      1 drain* fatgpu005
15fat_gpu_filler    up    1:00:00      5    mix fatgpu[001,003-004,006-007]
16fat_gpu_filler    up    1:00:00      1   idle fatgpu002
17vis               up 1-00:00:00      3   idle vis[001-003]
Requesting Nodes of a Partition
SLURM provides two commands to request resources.
srun is used to start an interactive session.
1[login_id@login001 ~]$ srun -N 1 --partition=cpu --job-name=test --time=00:05:00 --account=testproj_0000 --pty bash
2[login_id@cpu001 ~]$
sbatch is used to request resources that will execute a job script.
1[login_id@login001 ~]$ sbatch -N 1 --partition=cpu --job-name=test --time=00:05:00 --account=testproj_0000 myscript.sh
2Submitted batch job 10290
For sbatch the submission flags can also be incorporated into the job script itself.
More information about job scripts, and the required and some optional flags can be found
in the Training/SLURM Header section.
On Elysium several flags are mandatory.
sbatch and srun will refuse to queue the job
and give a detailed explanation which flag is missing
and how to incorporate it into your command or script.
Use spredict myscript.sh to estimate the start time of your job.
Shared Nodes
All nodes are shared by default.
If a user requests fewer CPU-cores than a node provides, other users may use these resources at the same time.
To ensure that the requested nodes are not shared use the --exclusive flag.
If more than one node is requested the --exlusive flag is mandatory.
GPU Nodes
For requesting resources on a GPU node the --gpus=<number of GPUs> flag is required.
In order to allow for fairly shared resources the number of CPUs per GPU is limited.
Thus the --cpus-per-gpu=<number of CPU cores per GPU> is required as well.
For multi node jobs --gpus-per-node=<number of GPUs per node> option needs to be set.
Visualization Nodes
For requesting resources on a visualization node no --gpu parameter is needed.
The available GPU will automatically be shared between all jobs on the node.
List of Currently Running and Pending Jobs
If requested resources are currently not available, jobs are queued
and will start as soon as the resources are available again.
To check which jobs are currently running,
and which ones are pending and for what reason the
squeue command can be used.
For privacy reasons only the user’s own jobs are displayed.
1[login_id@login001 ~]$ squeue
2             JOBID PARTITION     NAME     USER ST       TIME  NODES NODELIST(REASON)
3             10290       cpu     test login_id  R       2:51      1 cpu001
List of Computing Resources Share
Users/Projects/Groups/Institutes are billed for computing resources used.
To check how many resources a user is entitled to
and how many they have already used the sshare command is used.
For privacy reasons only the user’s own shares are displayed.
1[login_id@login001 ~]$ sshare
2Account                    User  RawShares  NormShares    RawUsage  EffectvUsage  FairShare
3-------------------- ---------- ---------- ----------- ----------- ------------- ----------
4testproj_0000          login_id       1000    0.166667    20450435      0.163985   0.681818
List of Project Accounts
Due to technical reasons the project names on Elysium have rather cryptic names,
based on the loginID of the project manager and a number.
In order to make it easier to select a project account for the
--account flag for srun, or sbatch,
and to check the share and usage of projects,
the RUB-exclusive rub-acclist command can be used.
1[login_id@login001 ~]$ rub-acclist
2Project ID    | Project Description
3--------------+--------------------------------------------------
4testproj_0000 | The fundamental interconnectedness of all things
5testproj_0001 | The translated quaternion for optimal pivoting
Interactive Sessions
The Elysium cluster provides the possibility to work interactively
to allow compute intensive preparations, post processing steps, or tests.
Further, interactive sessions on the visualization nodes (vis[001-003])
allow for remote connections to run e.g. jupyter notebooks from your local machine.
Interactive Jobs
In order to reserve nodes interactively the following command should be used:
[login_id@login001 ~]$ srun -N 1 --partition=vis --job-name=interactive --time=01:00:00 --tasks-per-node=1 --account=<project_name> --pty bash
Depending on the load on the cluster it might take some time
until resources can be allocated for your job.
Even if resources are free the scheduler might need a
few seconds to reserve the requested node.
If you require a specific node for your interactive
session you may utilize the -w <nodename> flag.
Note that this might increase the time for your session
to start until the requested node is available.
(For more options on node allocations see
SLURM).
SSH From Login Node to Interactive Session
As long as you have any job running on the target node
you can use ssh to connect from any login node to your target node.
When the job terminates, all ssh connections will be terminated as well.
SSH From Local Machine to Interactive Session
Connection to compute nodes from local machines is only possible
for the three visualization nodes (vis[001-003]).
In order to allow a local machine to connect to a node with an active job,
one of the login nodes needs to be defined as a jump host, to forward your ssh request.
Please make sure that the ~/.ssh/config on your local machine
contains the following entries:
Host elysium-login001
    User <login_id>
    Hostname login001.elysium.hpc.rub.de
    IdentityFile ~/.ssh/elysium

Host *.elysium.hpc.rub.de *.elysium.hpc.ruhr-uni-bochum.de !login*.elysium.hpc.rub.de !login*.elysium.hpc.ruhr-uni-bochum.de
    User <login_id>
    IdentityFile ~/.ssh/elysium
    ProxyJump elysium-login001
Please ensure that the IdentityFile points to the correct (private) key.
You are now able to connect to connect to one of the vis nodes with the following command:
[localuser@localmachine ~]$ ssh vis001.elysium.hpc.rub.de
[<login_id>@vis001 ~]$
Visualization
We provide Visualization via VirtualGL on the visualization nodes on Elysium.hpc.ruhr-uni-bochum.de
Requirements:
X11 server with 24-bit- or 32-bit Visuals.
VirtualGL version > 3.0.2 installed.
You can check support for your Operating Sytsem at: https://virtualgl.org/Documentation/OSSupport
You can download VirtualGL at: https://github.com/VirtualGL/virtualgl/releases
To use VirtualGL on Elysium, you will only need the VirtualGL client, it is not necessary to configure a VirtualGL Server.
Resource allocation:
Allocate resources in the vis partition.
salloc -p vis -N1 --time=02:00:00 --account=testproj_0000
This will allocate a share of one vis node for 2 hours.
(For more options on node allocations see
SLURM).
Wait until a Slot in the vis partition is available.
You can check if your resources are already allocated using the ‘squeue’ command.
Establish Virtual GL connection:
Connect directly from your computer to the visualization node via ssh with vglonnect -s
Use one of the login servers login[001-004] as a jump host.
vglconnect -s <loginid>@vis001.elysium.hpc.rub.de -J <loginid>@login001.elysium.hpc.rub.de
If you are prompted for password, enter your RUB-password.
If you don’t like long commands, you can configure one of the login nodes as jump host in your ~/.ssh/config for the vis[001-003] hosts.
The command vglconnect -s accepts nearly the same syntax as ssh.
Run your Software:
Load a module if required.
Start your application using vglrun, please remember to use useful command line options like -fps .
module load vmd
vglrun +pr -fps 60 vmd
Please remember to cancel the resource allocation once you are done with your interactive session.
Job Monitoring
With our web-based job monitoring system (ClusterCockpit), you can easily monitor and analyze the performance of your jobs on the Elysium HPC system. For a quick performance check, see Metrics to Check; for an in-depth analysis, refer to the HPC-Wiki. For details on the web interface, consult the official documentation.
Login
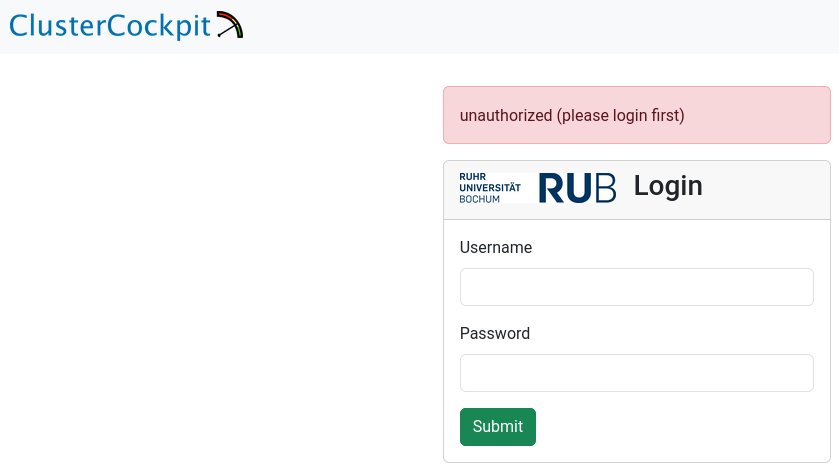
To access the job monitoring system, use your RUB LoginID and corresponding password as credentials.
Overview
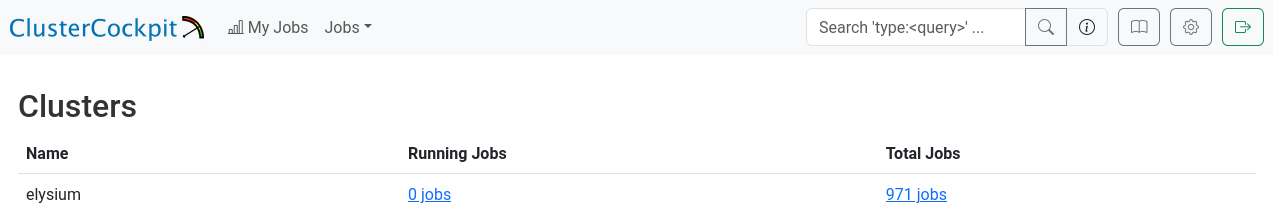
After logging in successfully, you will see the “Clusters” overview, which displays the total number of jobs you have run and the current number of jobs running on the cluster.
At present, this information includes only the Elysium cluster.
You can continue from here, either by going to the total jobs overview, or the running jobs overview.
Alternatively, you can click on “My Jobs” in the top left of the page, or search for job names/ids in the top right of the page.
My Jobs
The “My Jobs” page displays a list of your jobs, fully customizable to your requirements. Use the menus in the top left corner to sort or filter the list, and select the metrics you want to display for your jobs. Below, you’ll find a detailed table with job IDs, names, and your selected metrics.

Job Details
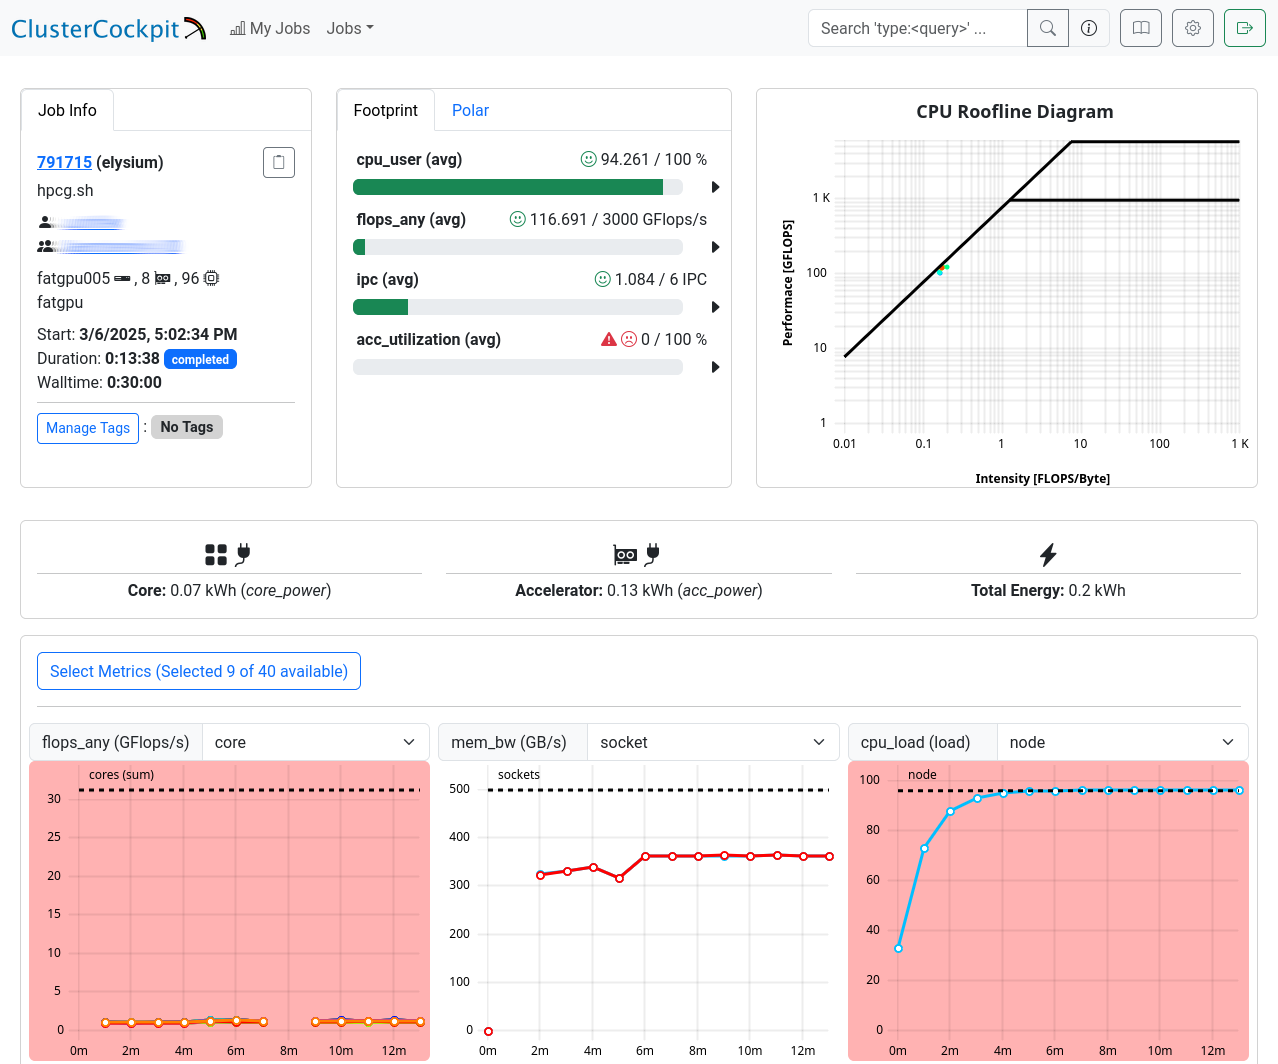
This page is split into three sections.
The first one shows general information: JobInfo, a footprint and a
roofline diagram
that shows how efficiently the job utilized the hardware.
Note that the footprint is only updated every 10 minutes and the energy footprint is generated after the job finished.
In the next section some metrics are shown as diagrams. For some of the diagrams you can choose the scope, i.e. core, socket or node.
The shown metrics and their order can be customized with the “Select Metrics” menu. This selection is saved per partition.
Double-click the graph to zoom out if the scale is too small.
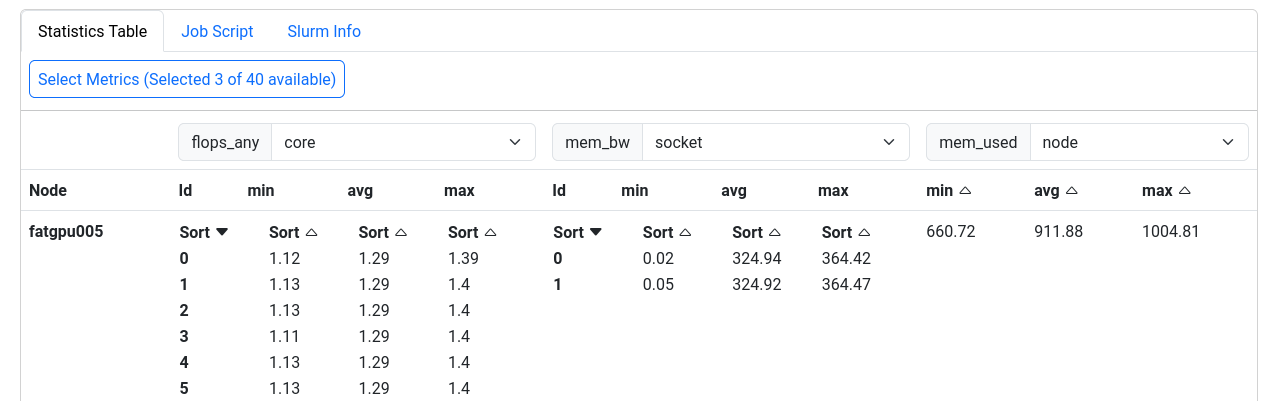
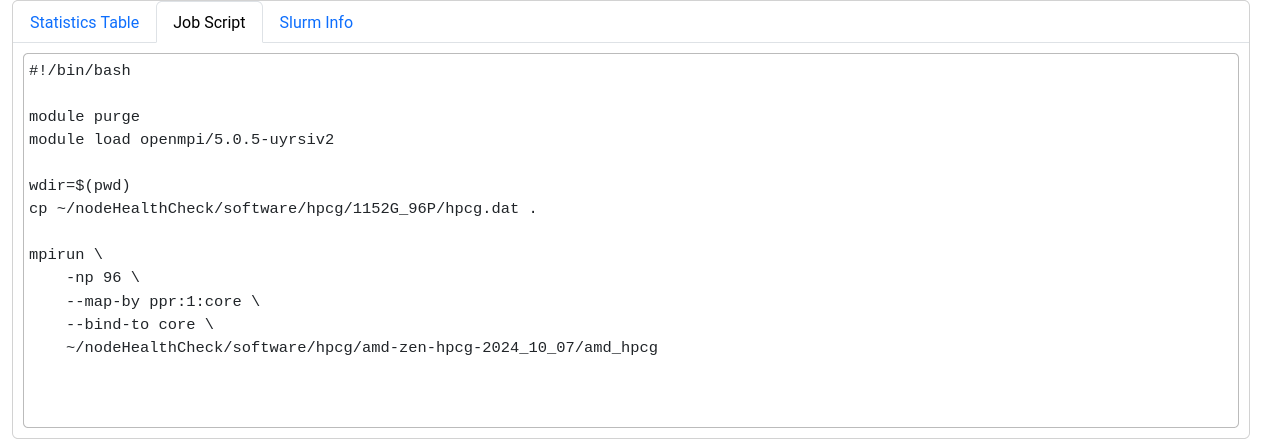
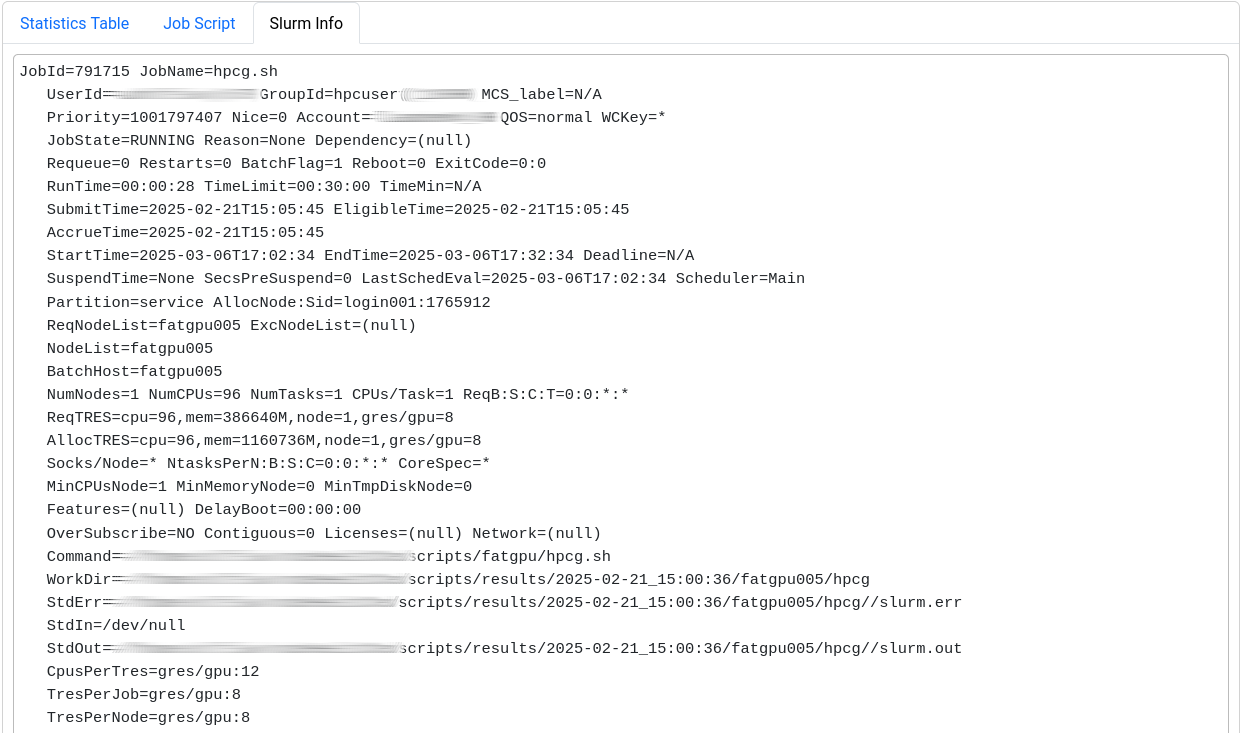
The last section displays selected metrics in a numerical way,
lets you inspect your job script, and shows more detail about
the job allocation an runtime parameters.
Metrics
The following table shows the metrics which are available for jobs on Elysium:
| Metric name |
Meaning |
Meaningful for shared jobs |
| CPU |
|
|
| cpu_load |
Load on the node (processes/threads requesting CPU time) |
No |
| cpu_load_core |
Load on CPU cores of a job (processes/threads per core) |
Yes |
| cpu_user |
Percentage of CPU time spent as user time for each CPU core |
Yes |
| clock |
Frequency of the CPU cores of the job |
Yes (affected by other jobs) |
| ipc |
Instructions per cycle |
Yes |
| flops_any |
Floating-point operations performed by CPU cores |
Yes |
| core_power |
Power consumption of individual CPU cores |
Yes |
| Memory |
|
|
| mem_bw |
Memory bandwidth |
No (full socket only) |
| mem_used |
Main memory used on the node |
No |
| job_mem_used |
Main memory used for the job |
Yes |
| disk_free |
Free disk space on the node |
No |
| GPU |
|
|
| nv_compute_processes |
Number of processes using the GPU |
Yes |
| acc_mem_used |
Accelerator (GPU) memory usage |
Yes |
| acc_mem_util |
Accelerator (GPU) memory utilization |
Yes |
| acc_power |
Accelerator (GPU) power usage |
Yes |
| acc_utilization |
Accelerator (GPU) compute utilization |
Yes |
| Filesystem |
|
|
| lustre_write_bw |
/lustre write bandwidth |
No |
| lustre_read_bw |
/lustre read bandwidth |
No |
| lustre_close |
/lustre file close requests |
No |
| lustre_open |
/lustre file open requests |
No |
| lustre_statfs |
/lustre file stat requests |
No |
| io_reads |
Local Disk I/O read operations/s |
No |
| io_writes |
Local Disk I/O write operations/s |
No |
| nfs4_close |
/home + /cluster file close requests |
No |
| nfs4_open |
/home + /cluster file open requests |
No |
| nfsio_nread |
/home I/O read bandwidth |
No |
| nfsio_nwrite |
/home I/O write bandwidth |
No |
| Network |
|
|
| ib_recv |
Omnipath receive bandwidth |
No |
| ib_xmit |
Omnipath transmit bandwidth |
No |
| ib_recv_pkts |
Omnipath received packets/s |
No |
| ib_xmit_pkts |
Omnipath transmitted packets/s |
No |
| net_bytes_in |
Ethernet incoming bandwidth |
No |
| net_bytes_out |
Ethernet outgoing bandwidth |
No |
| net_pkts_in |
Ethernet incoming packets/s |
No |
| net_pkts_out |
Ethernet outgoing packets/s |
No |
| NUMA Nodes |
|
|
| numastats_numa_hit |
NUMA hits/s |
No |
| numastats_numa_miss |
NUMA misses/s |
No |
| numastats_interleave_hit |
NUMA interleave hits/s |
No |
| numastats_local_node |
NUMA local node accesses/s |
No |
| numastats_numa_foreign |
NUMA foreign node accesses/s |
No |
| numastats_other_node |
NUMA other node accesses/s |
No |
| Node metrics |
|
|
| node_total_power |
Power consumption of the whole node |
No |
Metrics to Check
For a quick performance analysis, here are some key metrics to review:
cpu_user: Should be close to 100%. Lower values indicate system processes are using some of your resources.flops_any: Measures calculations per second. On Elysium, a typical CPU node averages around 400 GFLOPS.cpu_load_core: Should be 1 at most for non-OpenMP jobs. Higher values suggest oversubscription.ipc: Instructions executed per cycle. Higher values indicate better efficiency.mem_bw: Memory bandwidth, maxing out at 350 GByte/s. Only meaningful if the node isn’t shared or your job uses a full socket.acc_utilization: GPU compute utilization. Aim for high percentages (e.g., above 80%) to ensure efficient GPU usage.
Known Problems
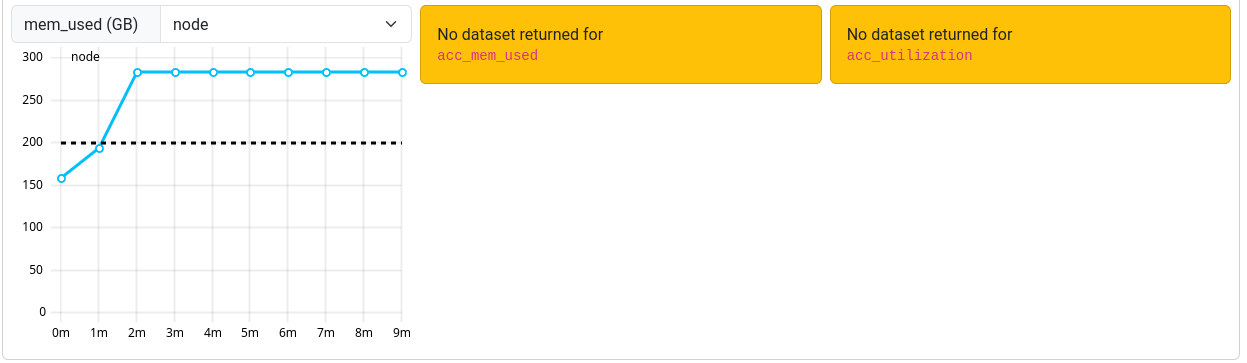
Occasionally, an orange box labeled “No dataset returned for <metric>” may be shown instead of the graph.
This occurs when the ClusterCockpit service was unable to collect the metrics during your job.
 Note that jobs that ran before March 12th 2025 may report missing or incorrect data in some cases.
The measurements for ipc and clock are sometimes too high. This is related to power saving features of the CPU. We are currently investigating how to solve this issue.
For jobs that ran before March 7th 2025 a bug triggered an overflow for the power usage metric resulting in unrealisticly high power consumptions.
This bug is fixed, but the fix cannot be applied to older jobs that were affected by it.

Advanced Permissions
On the elysium cluster every user is in the default hpcuser group. For this reason it is important that you don’t set group and other permission to read/writeable. If you want to actually share files with other people there are 2 solutions.
LDAP Groups
You can request an LDAP group to be added to the cluster.
https://www.it-services.ruhr-uni-bochum.de/services/ias/benutzergruppen_ldap.html.de
With this you can manage a group of people that are automatically added/removed on every folder that has those group permissions.
Advanced ACLs
Linux supports ACLs which allow you to manually grant people or groups permission to read/write to shared folders. Note that this will only work on /lustre for now.
Adding permission
To grant a specific user access to a folder you can use setfacl.
Normally you don’t want to grant other users complete access to your /home or /lustre folder so here is an example workflow how to create a folder with extra permissions to share. In the example alice shares a folder with bob. In this example we share the bob-share folder in /lustre with bob.
# First give general permission to bob to access subfolders
[alice@elysium ~] setfacl -m u:bob:x /lustre/alice/
# Then set the `default` permission to read, write and execute.
# Every new file/folder in `bob-share` will inherit this
[alice@elysium ~] setfacl -d -m u:bob:rwx /lustre/alice/bob-share
# If files already existed in the share directory apply those recursively
[alice@elysium ~] setfacl -d -R -m u:bob:rwx /lustre/alice/bob-share
Check permissions
[alice@elysium ~] ls -l /lustre/alice/
total 0
drwxrwxr-x+  2 alice hpcuser 4096 Feb 26 16:06 bob-share
The + shows that there are additional permissions set.
[alice@elysium ~] getfacl /lustre/alice/bob-share
getfacl: Removing leading '/' from absolute path names
user::rwx
group::r-x
other::r-x
default:user::rwx
default:user:bob:rwx
default:group::r-x
default:mask::rwx
default:other::r-x
Remove permissions
To remove all ACLs recursively you could do this
setfacl -b -R /lustre/alice/bob-share
You of course have more fine grained controls, but for every additional use case please consult the man page of getfacl/setfacl.
Please don’t open a ticket if this does not work on your home directory.